Introduction
In the fast-paced world of cryptocurrency and stock trading, identifying trends can make or break your investment strategy. The Golden Cross and Death Cross are two widely recognized chart patterns that help traders determine potential market shifts. This article explores these key indicators and provides insights on using them effectively in your trading journey.
Understanding the Basics of Moving Averages
Moving averages are foundational tools in technical analysis, helping smooth out price data to identify trends. Here’s a quick look at the types of moving averages commonly used:
| Type of Moving Average | Calculation | Best Used For |
|---|---|---|
| Simple Moving Average (SMA) | Average of all closing prices over a specific period | Long-term trends |
| Exponential Moving Average (EMA) | Puts more weight on recent prices | Short-term trends |
What is a Golden Cross?
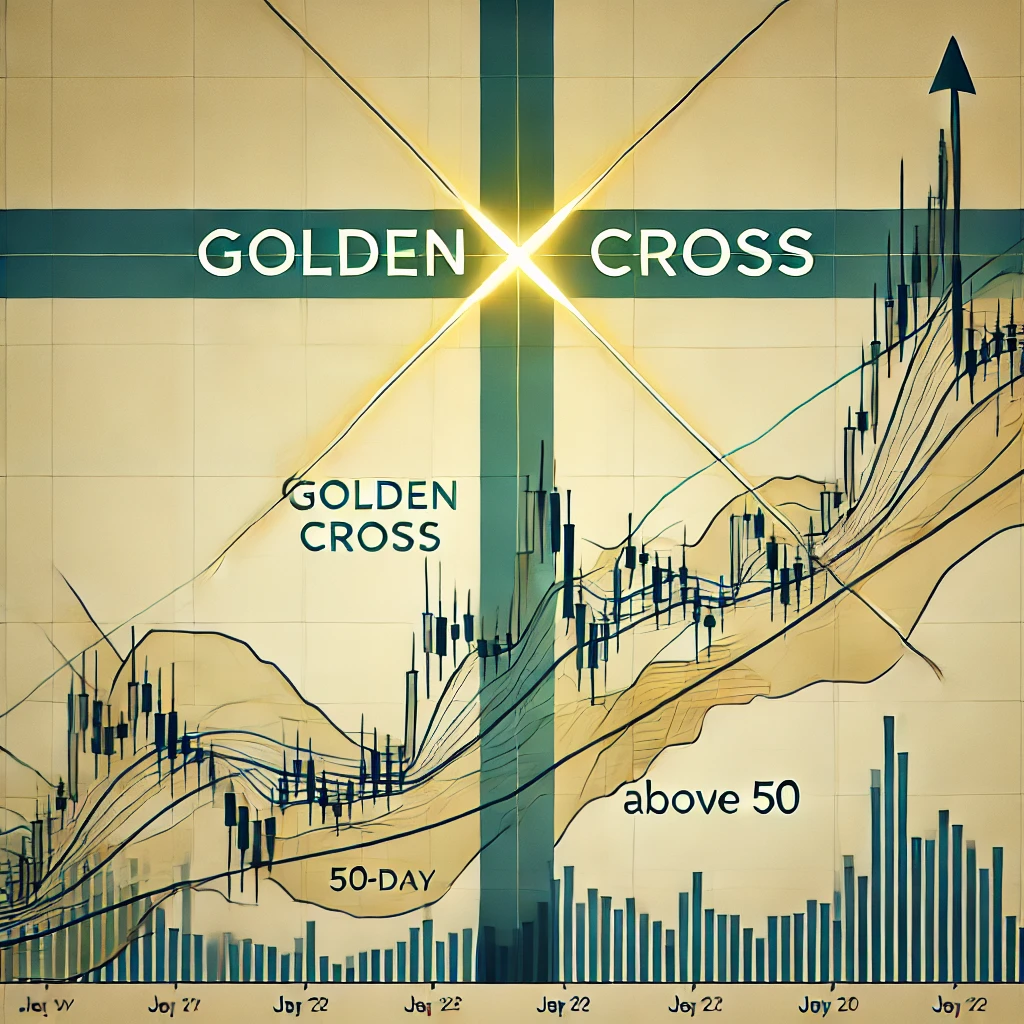
A Golden Cross is a bullish pattern that occurs when a short-term moving average (often the 50-day) crosses above a long-term moving average (typically the 200-day). This crossover suggests upward momentum, signaling a potential buying opportunity.

Example of a Golden Cross
In early 2023, a Golden Cross formed, marking the beginning of a prolonged upward trend in semiconductor stocks. The pattern indicated that investor sentiment was turning bullish, making it an ideal time to enter the market.
What is a Death Cross?
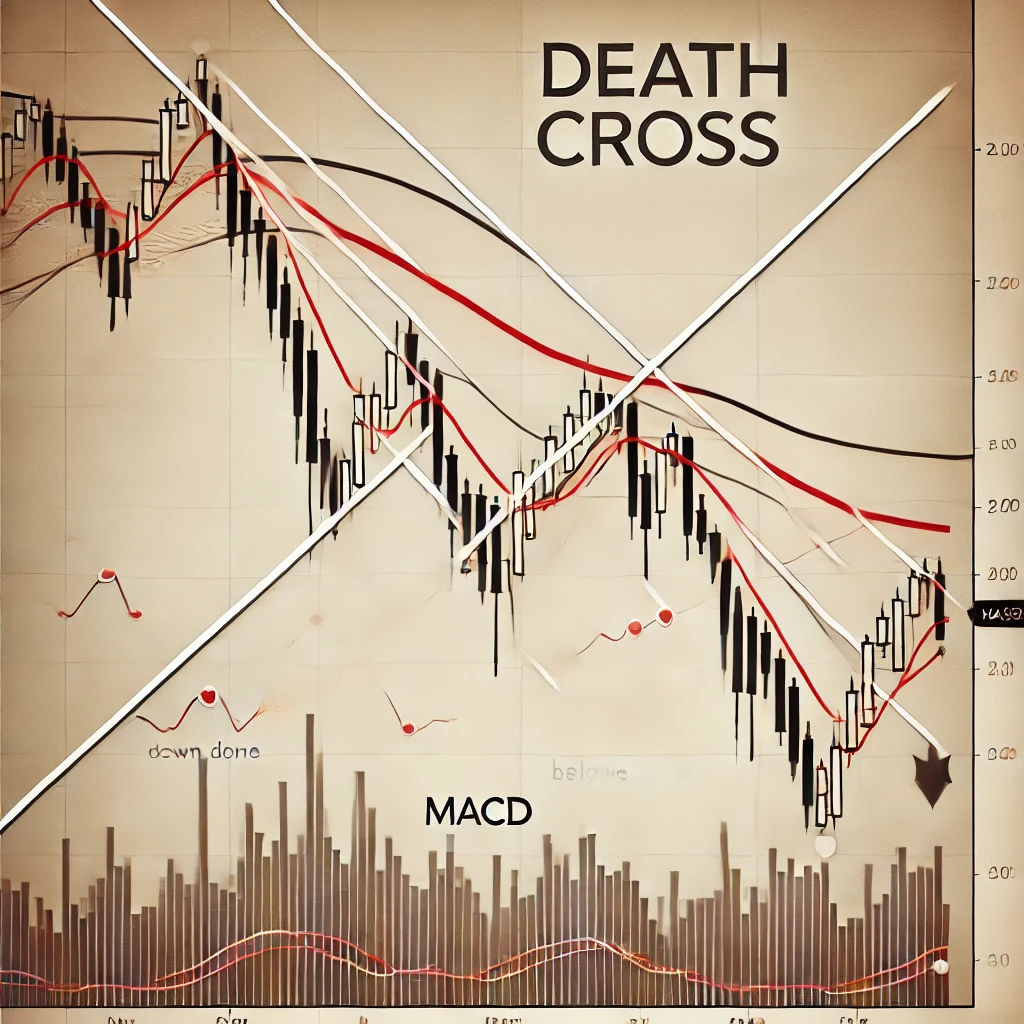
Conversely, a Death Cross signals a bearish market trend. It appears when a short-term moving average crosses below a long-term moving average, suggesting increased selling momentum. Traders often interpret this as a signal to exit positions or avoid new investments.

Example of a Death Cross
In 2022, the Death Cross in semiconductor stocks confirmed a downtrend, alerting traders to exercise caution. This pattern can indicate extended bearish momentum and potentially mark the start of a prolonged decline.
Golden Cross vs. Death Cross: Reliability and Limitations
While Golden Cross and Death Cross patterns are valuable, they aren’t infallible. Both are lagging indicators and may give false signals in a sideways market. Here’s a quick comparison of when each might be useful:
| Indicator | Signal | Best Conditions | Limitations |
|---|---|---|---|
| Golden Cross | Bullish | Strong uptrend | Can give false signals in choppy markets |
| Death Cross | Bearish | Strong downtrend | May not be reliable in a ranging market |
Using Crossovers in a Trading Strategy
When used alongside other technical indicators, Golden and Death Cross patterns become more reliable. Here are some strategies to maximize their effectiveness:
- Confirm with Volume: Look for higher trading volume during the crossover to validate the trend.
- Pair with Momentum Indicators: Indicators like the RSI or MACD can help confirm the trend strength.
- Combine with Fundamental Analysis: Monitor economic and company-specific news to avoid false signals.
FAQs
Q1: Are Golden Cross and Death Cross patterns reliable for cryptocurrency?
A1: These patterns work across various markets, including cryptocurrency. However, crypto’s volatility may lead to more frequent false signals, so it’s advisable to combine them with additional indicators.
Q2: Can I rely on these patterns alone for trading?
A2: While helpful, Golden Cross and Death Cross patterns should be used with other technical and fundamental indicators for better accuracy.
Q3: What are the best time frames for identifying these patterns?
A3: For long-term trends, the 50-day and 200-day moving averages are widely used. Shorter periods, like 15-day and 50-day, are preferred for short-term trading.
Conclusion
The Golden Cross and Death Cross are powerful tools for identifying potential trend reversals in the crypto and stock markets. They offer valuable insights but remember to use them in conjunction with other analysis tools to improve accuracy. These patterns can guide entry and exit points, helping you stay one step ahead in the market.
Internal Links
- Top 5 Best Crypto Options Exchanges in 2024 for Smart Trading: For traders looking for secure platforms.
- Is Bitcoin’s Reign Over? A Deep Dive into the Recent Price Plunge: Analyzing recent trends in Bitcoin.
- Stablecoins: Understanding the Role of Price Stability in Cryptocurrency: Exploring stablecoins as an alternative investment.
External Links
- Investopedia on Moving Averages: A detailed guide to moving averages.
- CoinMarketCap Guide to Technical Indicators: Understanding various technical indicators.


Leave a Comment